

Friendship Statistics: How Often Do Adults See Their Friends?
Texting a friend and spending time together are different measures. Explore US friendship statistics and a separate Canadian historical comparison, with sources and downloadable charts.
Compiled by CardYard. Research reviewed September 13, 2026. This guide interprets published research; it is not a CardYard survey. The cover is an AI-generated illustration.
Among US adults with close friends, 61% text a friend at least a few times a week, while 29% see one in person that often. Pew Research Center, 2024 fieldwork; published January 2025.
The US survey asks about adults with close friends; Canada's time-use series tracks an average day. They measure different populations and behaviors.
What are the key friendship statistics?
74% connect frequently through at least one method among US adults with close friends. “Frequently” means at least a few times a week. Pew, 2024 fieldwork.
72% of adults under 30 with close friends text a friend frequently. Pew, 2024 fieldwork.
47.9% versus 19.3% saw friends on an average day in Canada in 1986 and 2022; the population is ages 15+. Statistics Canada, 2025 release.
On this page: Texting versus meeting · Contact and age · Canadian history · Methods · Game night
How often do adults see friends compared with texting them?
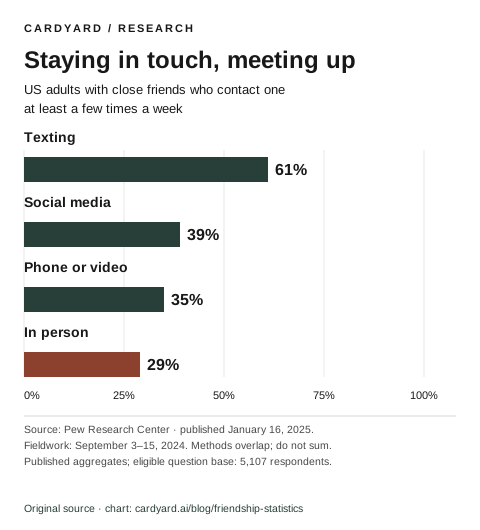
Method | At least a few times weekly |
|---|---|
Texting | 61% |
Social media | 39% |
Phone or video | 35% |
In person | 29% |
Source: Pew Research Center. These are shares of people, not shares of conversations or minutes. Open or download the US chart (SVG).
Methods overlap: one person may text, call and meet a friend in the same week. Do not add the percentages or infer that people who text never meet; the published aggregates do not show individual overlap.
How does contact with friends differ by age?
Adults under 30 are the most likely to report frequent texting and social-media contact with a close friend. Pew reports 72% for texting and 60% for social media in this age group. Source: Pew, 2024 fieldwork.
These percentages are within age groups, not the share of all texters; this snapshot cannot show how one person's habits change with age.
Pew asked contact questions only of respondents with at least one close friend. See the COMMFRI question and eligible base in the topline.
Has the time people spend with friends changed?
In Canada, the share seeing friends on an average day fell from 47.9% in 1986 to 19.3% in 2022. This separate time-diary comparison covers people aged 15 and older, not US adults. Source: Statistics Canada, June 17, 2025.
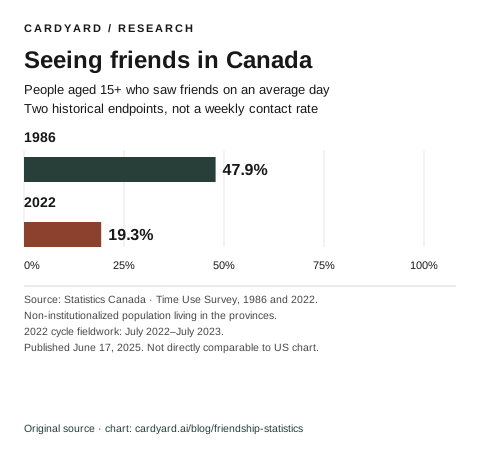
Survey year | Share |
|---|---|
1986 | 47.9% |
2022 | 19.3% |
Source: Statistics Canada, chart 2 and accompanying text. Open or download the Canadian chart (SVG).
An average-day diary is not a weekly rate; the age-15+ Canadian series measures a different population and behavior from Pew's US weekly question.
These endpoints do not explain why the share changed or show the path between survey years; they cannot establish that phones or any other factor caused a decline.
Where do these adult friendship statistics come from?
Pew and Statistics Canada measure different things. Dates below separate fieldwork from publication; 2026 is the review year, not a new survey year.
United States: Pew Research Center
The survey ran September 3–15, 2024, with 6,204 US adult respondents from the American Trends Panel and SSRS Opinion Panel. Results were weighted to represent the adult population. The contact-frequency question had an eligible base of 5,107 respondents with close friends. Methods · Topline, COMMFRI.
Use published combined estimates rather than adding rounded table entries: rounding can make the results differ. The full-study margin of error is not automatically a margin of error for a smaller subgroup. Survey wording, sampling and nonresponse also matter when interpreting an estimate. Pew's methodology and limitations.
Canada: Statistics Canada
The Time Use Survey uses a 24-hour diary. Its target population is non-institutionalized people aged 15+ living in the provinces. The 2022 cycle collected responses from July 2022 to July 2023. Time with others excludes sleeping and personal-care activities. Methods and definitions, pages 4–5.
Game night
Try Charades or Match the Room.