
Board Game Statistics 2026: Who Plays, How Often, and Why
A source-linked guide to board game participation, player demographics and family game nights, with clear dates, survey samples and limits on what the numbers mean.
Compiled by CardYard. Sources checked September 12, 2026. This is a synthesis of published research, not a CardYard survey.
These board game statistics separate three questions that often get mixed together: who enjoys games, who actually plays regularly, and what makes a game night appealing or difficult to organize.
The US findings lead this guide. International attitudes and a smaller family survey appear in separate sections because they describe different groups. Use the source links beside the findings to check the original research before quoting a number.
What are the key board game statistics?
65% of US adult citizens enjoy board games. YouGov, May 2026.
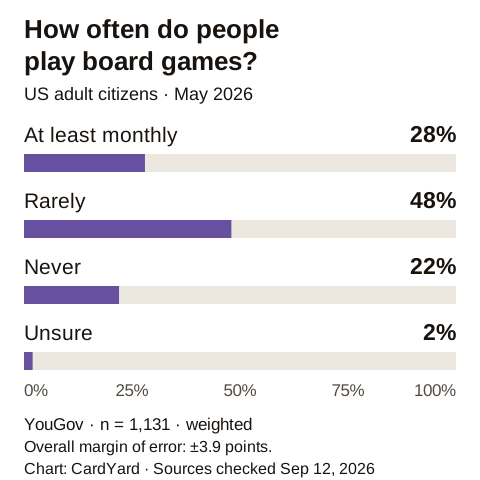
28% play at least monthly. YouGov, US adult citizens, May 2026.
48% play rarely. YouGov, US adult citizens, May 2026.
28% versus 12% love board games among ages 18–29 and 65+, respectively. YouGov, May 2026.
53% have played Monopoly many times. YouGov, US adult citizens, May 2026.
57% prefer a Saturday tabletop game at home to going out. Kantar/Asmodee, five-country adult sample, May 2026.
65% say tabletop games bring friends and family closer. Kantar/Asmodee, five-country adult sample, May 2026.
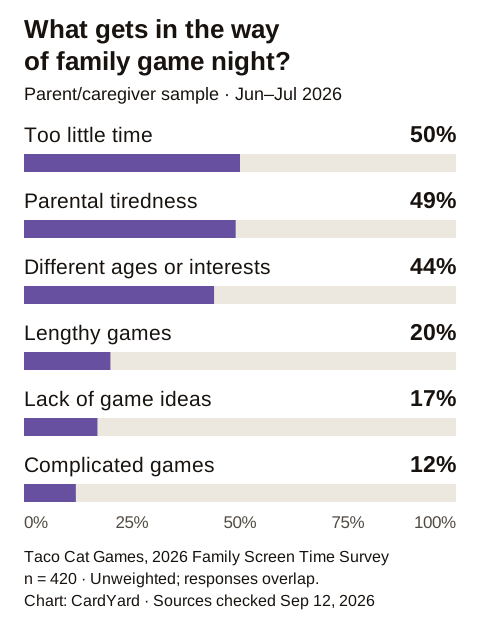
50% identify limited time as a family game-night barrier. Taco Cat Games, 2026 Family Screen Time Survey; 420 parents/caregivers, unweighted.
Quick takeaways summarize the sections below; they are not additional independent findings.
On this page: Playing frequency · Player demographics · Familiar games · In-person and digital play · Social attitudes · Family game nights · Using the numbers · Sources and methodology · Citation guidance
How often do Americans play board games?
28% play at least monthly; 48% rarely, 22% never and 2% are unsure. These are YouGov's May 2026 results for US adult citizens. Source: YouGov tables, question 1.
Frequency | Share |
|---|---|
At least monthly | 28% |
Rarely | 48% |
Never | 22% |
Unsure | 2% |
Source: YouGov, question 1. Overall study margin of error: ±3.9 percentage points, adjusted for weighting; this is not a separate interval for every subgroup.
Enjoyment is a different measure: 21% love board games and 44% like them; 29% are neutral and 6% dislike or hate them. Source: YouGov, May 2026.
An audience can like the idea of playing without making it a routine. That distinction matters when writing about demand: an enjoyment figure does not describe weekly players, paying customers or households ready to buy another game.
For a game-night host, the practical question is how often the invited people play, not whether they belong to a supposedly universal board-game audience. Ask what they already know and how much time they want to spend. Those answers can guide a particular evening more directly than a national average.
Which age groups enjoy board games?
28% of adults aged 18–29 love board games, compared with 12% of those aged 65 or older. Both figures describe age groups within YouGov's US adult-citizen survey. Source: YouGov, May 2026.
This is an attitude comparison, not a breakdown of everyone who plays. It cannot tell us what share of all board-game players belongs to either age group. The denominator changes with the age category: the younger group's percentage is calculated within that group, and the older group's within the older group.
That makes the figures useful for a narrowly framed demographic statement, but not for a headline declaring that board games are only for young adults. Nor does a cross-sectional survey establish that the same people become less enthusiastic as they age. Answering that would require following people over time or comparing carefully matched repeated studies.
Which board games have Americans played repeatedly?
53% report playing Monopoly many times. Selected comparisons on the same response scale are Scrabble at 37%, Pictionary at 11% and Codenames at 2%. Source: YouGov, May 2026, question 5.
Game | Played “many times” |
|---|---|
Monopoly | 53% |
Scrabble | 37% |
Pictionary | 11% |
Codenames | 2% |
These four titles illustrate familiarity; they are not the survey's top four games. Repeated past experience is also not the same as current popularity. A respondent might remember a game from childhood without having played it recently.
Use this comparison when discussing shared reference points or the challenge of introducing unfamiliar rules. Do not turn it into a sales ranking, an ownership estimate or a claim about the best games. A purchasing decision needs different evidence from a question about lifetime experience.
Do people play board games in person or digitally?
26% report playing in person very often, versus 6% digitally against other people. These use the full respondent base in YouGov's published tables, including a not-asked category for people who never play. Source: YouGov, May 2026, question 4.
They are not percentages of game sessions. They also are not percentages recalculated among players only. Someone may use more than one format, so the figures cannot be added into a split between physical and digital gaming.
The survey categories should not be stretched to cover every hybrid experience. Reading prompts from one phone while friends sit together, playing a digital adaptation remotely, and using software to generate a deck are different activities. This table does not separately measure each one, so it cannot establish demand for a particular app or feature.
Why do people say they like tabletop game nights?
57% prefer a Saturday tabletop game at home to going out in Kantar's five-country study for Asmodee. Source: Asmodee release, June 4, 2026; fieldwork May 2026.
The same study reports 56% saying games ease social pressure, 65% saying they strengthen closeness with family and friends, and 51% saying conversation about meaningful or awkward subjects is easier during play. Source: Kantar/Asmodee.
These are combined results from 5,000 adults across the US, UK, France, Germany and Sweden, not US-only or worldwide estimates. Asmodee, a game publisher, commissioned the study. These are reported attitudes, not experimentally measured effects.
The distinction between a preference and an observed choice is important here. A person can prefer the idea of staying in without doing so on their next free Saturday. A writer can accurately describe the preference while leaving actual attendance, spending and frequency unanswered.
Likewise, a social attitude should not become a health promise. These results do not show that a particular game treats anxiety, reduces loneliness or improves a clinical outcome. They can introduce a discussion about shared leisure, provided the language stays close to what respondents were asked.
What gets in the way of family game night?
Limited time, parental tiredness and differing ages or interests lead the reported obstacles in Taco Cat Games' survey. Source: Taco Cat Games, 2026 Family Screen Time Survey.
Reported obstacle | Share |
|---|---|
Too little time | 50% |
Parental tiredness | 49% |
Different ages or interests | 44% |
Lengthy games | 20% |
Lack of game ideas | 17% |
Complicated games | 12% |
Source: Taco Cat Games, 2026 Family Screen Time Survey. The anonymous online survey was unweighted. Recruitment details and a geographic breakdown are not published; these percentages should not be described as nationally representative.
92% of surveyed parents say their children would likely join an appealing family game; 73% report greater engagement during game night than screen time. These are parents' assessments, not direct observations of children's behavior. Source: Taco Cat Games, June–July 2026.
For planning an evening, use the barriers as questions to ask, not as a diagnosis of every family. Is there a small window of time? Does someone need help learning the rules? Would different ages prefer teams or individual turns? The survey cannot choose the right format for a household it did not study.
A reasonable hosting approach is to offer a short first round and let the group decide whether to continue. That is our practical suggestion, not a tested intervention from this survey. Avoid promising that a faster game will solve screen-time disagreements or make reluctant children participate.
How should you use these board game statistics?
Match each number to the question it actually answers. Participation, enjoyment, familiarity and stated social benefits are different measures. Keeping them separate makes a statistic more useful and a citation easier to verify.
For journalists: retain the population and fieldwork year in the sentence carrying the number. Follow the primary-source link rather than citing an unattributed screenshot.
For event organizers: use population research for background, then ask your own guests about time, accessibility, interests and experience. A national average is not a substitute for knowing the group.
For game creators: treat survey responses as hypotheses worth testing. Neither enjoyment nor an intention to play establishes willingness to pay for a particular product.
For researchers: check question wording and response bases before comparing percentages across sources. Similar-sounding questions can measure different things.
This guide deliberately leaves out market-size forecasts, unsupported growth claims and clinical claims. Revenue estimates depend on which products a market report includes; they would not answer the participation questions here. A single survey snapshot also cannot tell us whether board gaming is growing or declining.
Where do these statistics come from?
Three published surveys provide the evidence. CardYard selected findings relevant to participation and shared play, checked the original pages or tables, and created the two charts. We did not collect respondent data, combine the samples or commission this research.
Study and dates | Sample and scope | Important limitation |
|---|---|---|
YouGov | 1,131 US adult citizens; weighted opt-in panel | Self-report; overall ±3.9-point margin does not describe every subgroup. |
Kantar for Asmodee | 5,000 adults, 1,000 per country: US, UK, France, Germany, Sweden | Publisher-commissioned; combined-country attitudes, not global estimates. |
Taco Cat Games | 420 parents/caregivers; anonymous online sample | Unweighted; recruitment and geographic composition undisclosed. |
Percentages retain the publishers' rounding. The playing-frequency chart combines the daily, weekly and monthly categories in the original YouGov table; the family chart keeps overlapping answers separate. We have not reconstructed respondent counts from rounded percentages or manufactured confidence intervals.
There is a small discrepancy between YouGov's article and its table for the weekly category. This guide uses the original table for the chart aggregation and does not quote the conflicting weekly figure separately. The monthly-or-more total agrees with the article.
The year in the title refers to this edition and the included fieldwork. A source-review date is not a new survey date. When a newer study becomes available, the relevant section should be checked and revised substantively; changing the title alone would not make the evidence newer.
How can you cite this guide or its charts?
Credit the original survey when using a finding, and CardYard when using our synthesis or chart. A useful reference contains the publisher, study date, population and direct source link. Keep the sample limitations with any chart reused elsewhere.
Suggested guide citation: CardYard, Board Game Statistics 2026: Who Plays, How Often, and Why, sources reviewed September 12, 2026, cardyard.ai/blog/board-game-statistics.
The charts are available as playing-frequency SVG and family-barriers SVG. CardYard permits reuse of its chart designs with attribution; the underlying research remains credited to its original publisher. For corrections, contact CardYard with the finding and supporting source.
Ready to plan your own game night?
If your group wants shared prompts, try CardYard's charades generator or Match the Room, or browse all games. Choose a format for the people present. The research above did not test CardYard and should not be read as evidence of benefits from using it.